Advertisement
Quant Analyzer Tutorial: How to Analyze MT4 Backtest Reports
Quant Analyzer is a useful tool for analyzing MT4 backtest reports in more detail. If you only look at the standard MT4 Strategy Tester report, it can be difficult to find weak trading hours, bad months, large losing trades, or drawdown concentration.
By loading an MT4 backtest report into Quant Analyzer, you can review hourly, daily, monthly, and yearly performance, sort trades by profit or loss, and look for patterns that are not easy to see in MT4 alone.
Quick answer:
Quant Analyzer helps you analyze MT4 backtest reports beyond basic metrics such as win rate and profit factor. It is especially useful for finding weak time periods, reviewing large losing trades, and checking whether an EA has specific performance problems.
Quant Analyzer helps you analyze MT4 backtest reports beyond basic metrics such as win rate and profit factor. It is especially useful for finding weak time periods, reviewing large losing trades, and checking whether an EA has specific performance problems.
What Is Quant Analyzer?
Quant Analyzer is an external analysis tool that can read trading reports and display detailed performance statistics. For MT4 users, it is useful because it allows you to analyze backtest results from different angles.
For example, you can check:
- Hourly performance
- Daily and monthly profit/loss
- Yearly profit factor
- Largest winning and losing trades
- Trade duration
- Weak periods in a backtest
- Portfolio-level performance when combining multiple strategies
MT4 is good for running a backtest, but its built-in report is limited when you want to understand why an EA performs well or poorly. Quant Analyzer helps you see those weaknesses more clearly.
Note:
A free version of Quant Analyzer is available, but some advanced features are limited. For basic MT4 backtest review and learning, the free version can still be useful.
A free version of Quant Analyzer is available, but some advanced features are limited. For basic MT4 backtest review and learning, the free version can still be useful.
What You Can Analyze with Quant Analyzer
Before installing the tool, it is important to understand what kind of analysis Quant Analyzer is good at. The main benefit is that it helps you find performance patterns that are hidden in a normal MT4 report.
Hourly, Daily, Monthly, and Yearly Performance
One of the most useful features is checking profit and loss by time period. For example, you can find whether an EA performs poorly during a specific hour, day of the week, month, or year.
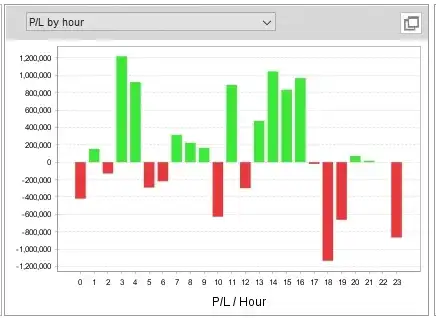
In this type of chart, you can quickly see whether a specific trading hour is hurting the overall performance. This is useful when you want to add a time filter to an EA.
Profit Factor by Year
You can also check performance by year. This is helpful when an EA performs well overall but has a few bad years hidden inside the long-term result.
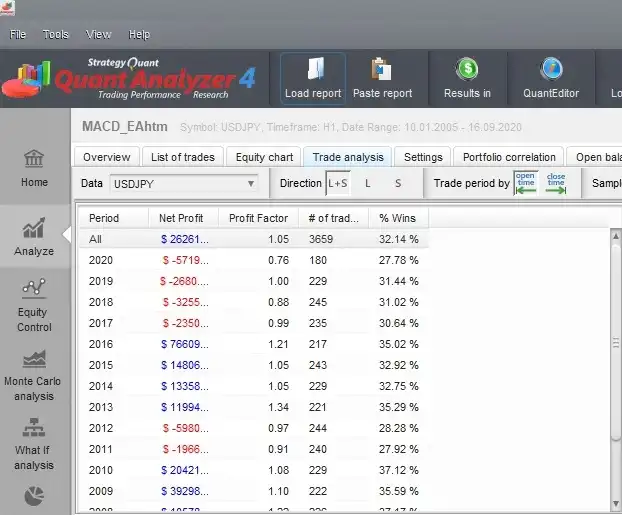
If one year is much worse than the others, you can review the trades from that period and check whether the market condition changed or the EA logic became weaker.
Sort Trades by Profit or Loss
Another useful feature is sorting trades by profit or loss. MT4 can show trade history, but it is not always easy to sort and review the biggest losing trades clearly, especially when there are many order modifications.
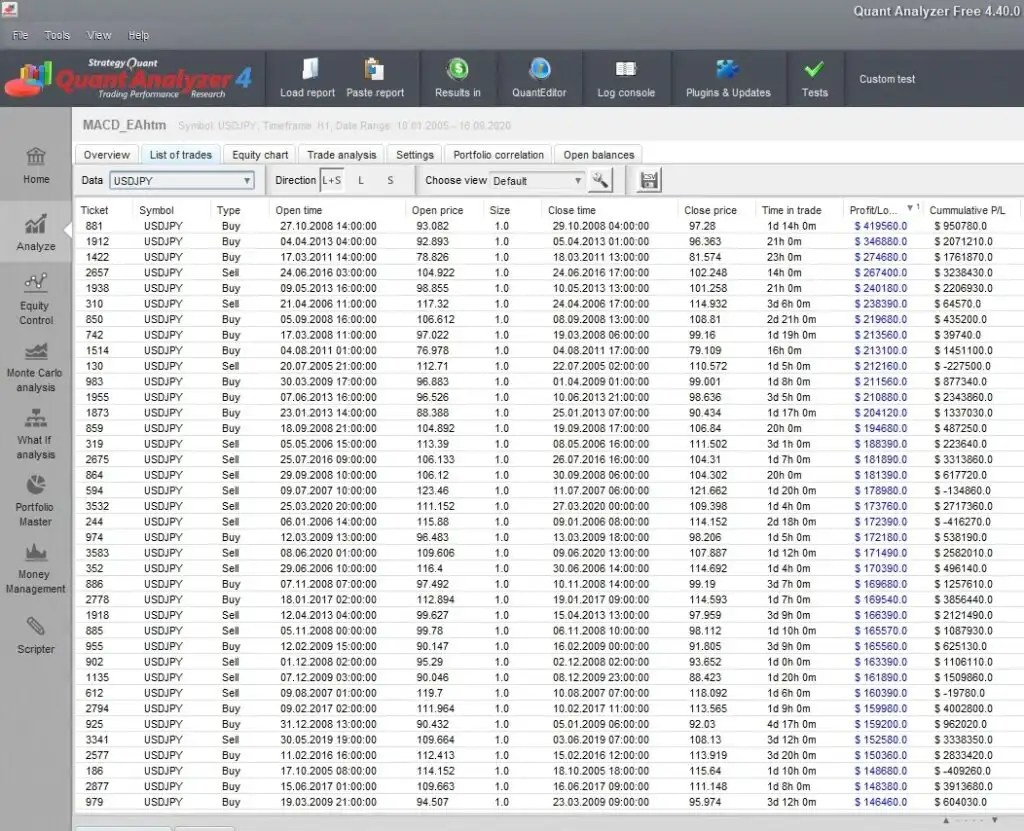
By sorting trades, you can focus on the trades that had the biggest impact on the backtest result. This is helpful when you want to understand what caused large losses.
How to Download and Install Quant Analyzer
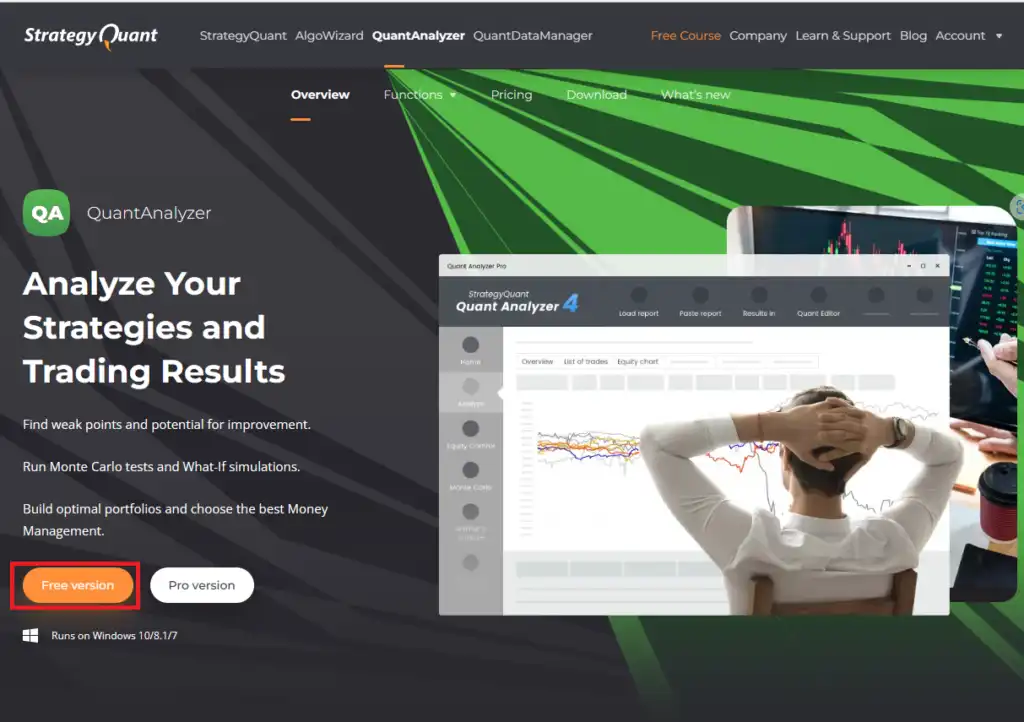
To use Quant Analyzer, first go to the official Quant Analyzer page and create an account.
Create a Free Account
On the Quant Analyzer page, click the button for the free version.
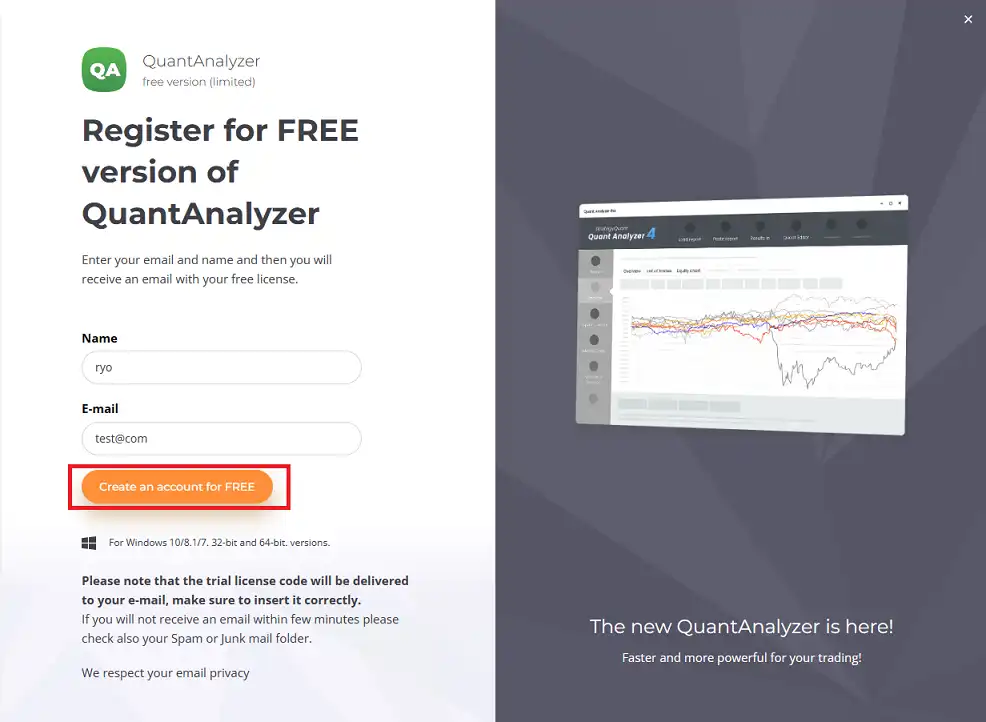
Enter your name and email address, then create a free account. You should use an email address that you can access because a confirmation email and license information may be sent to that address.
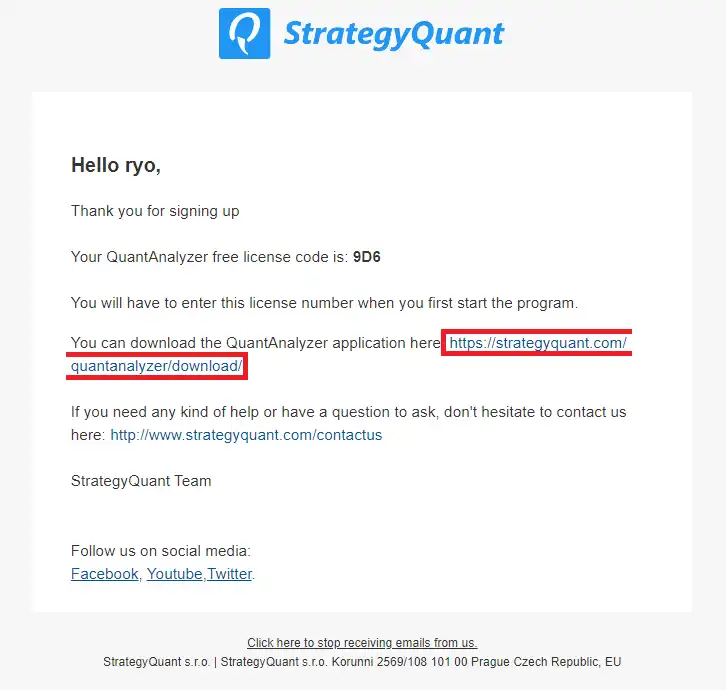
After registration, check your email and follow the confirmation link.
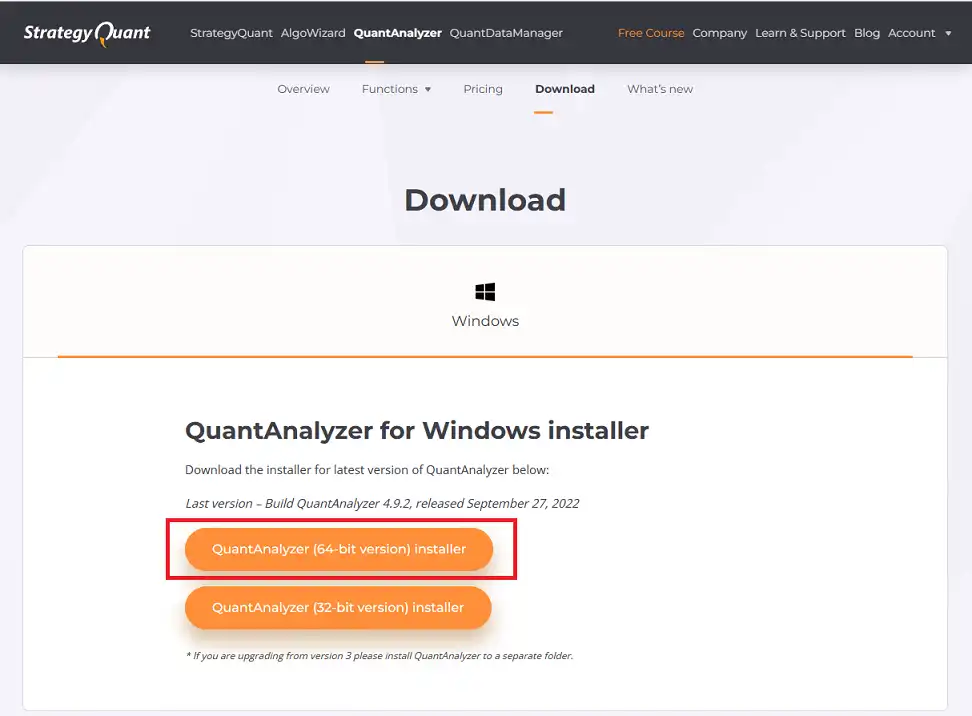
Download the Installer
After confirming your account, select the installer that matches your operating system.
Install Quant Analyzer
Run the downloaded setup file. The file name may include a version number, so the exact name can be different depending on the current release.
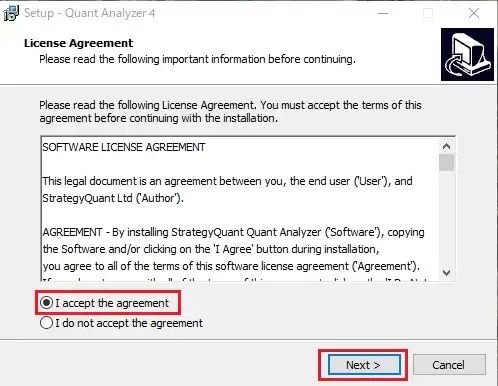
When the setup wizard starts, accept the license agreement and continue.
In most cases, you can continue with the default installation settings. When the final confirmation screen appears, click the install button and wait until the installation is complete.
After installation, launch Quant Analyzer and enter your license key if required. The license key is usually included in the email you receive after creating an account.
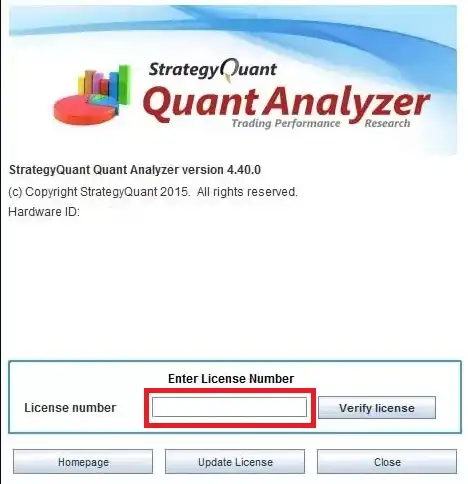
Once the license is verified, the installation is complete.
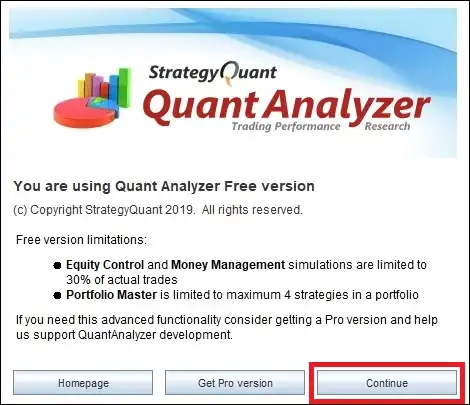
When you launch Quant Analyzer again later, you may see a start screen. Click Continue to open the tool.
How to Load an MT4 Backtest Report into Quant Analyzer
After installing Quant Analyzer, the next step is to export an MT4 backtest report and load it into the tool.
Step 1: Save the Backtest Report in MT4
First, run a backtest in MT4 Strategy Tester. After the test is complete, open the Report tab. Then right-click on the report area and choose Save as Report.
This will export the MT4 backtest result as an HTML report file.
Step 2: Load the Report in Quant Analyzer
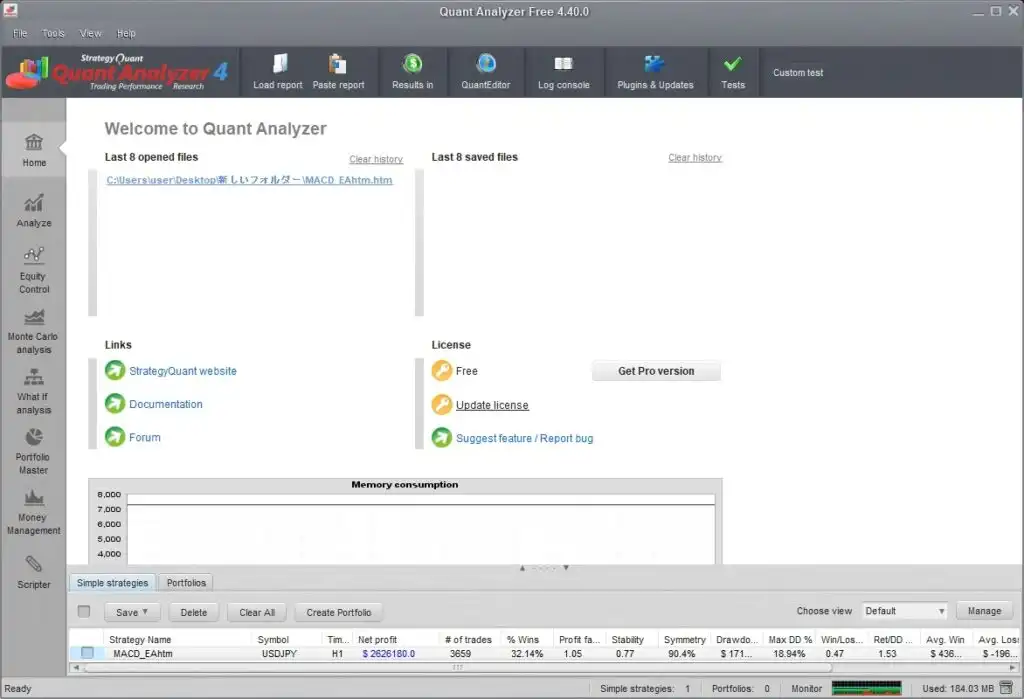
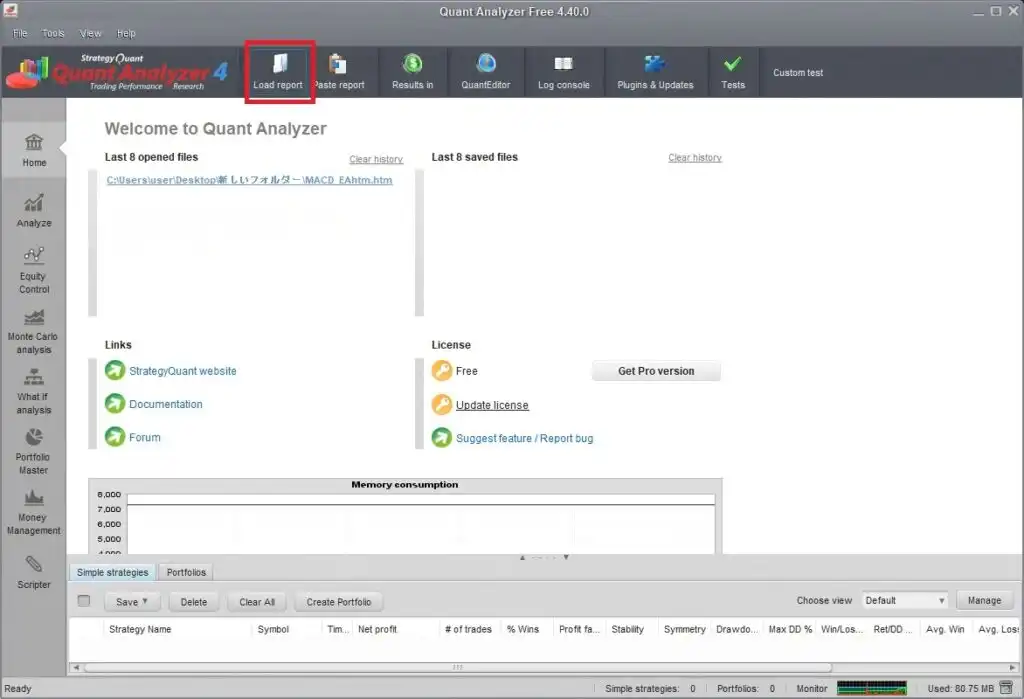
Open Quant Analyzer and click Load Report.
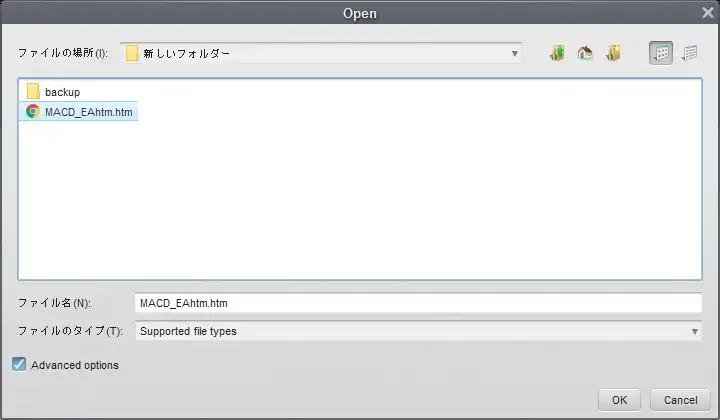
Select the MT4 report file you exported earlier, then click OK.
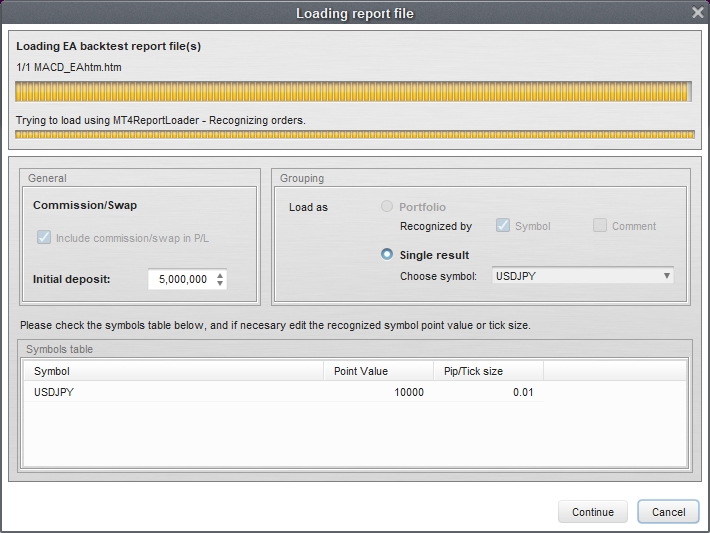
Quant Analyzer will load the file. When the progress bar reaches the end, click Continue.
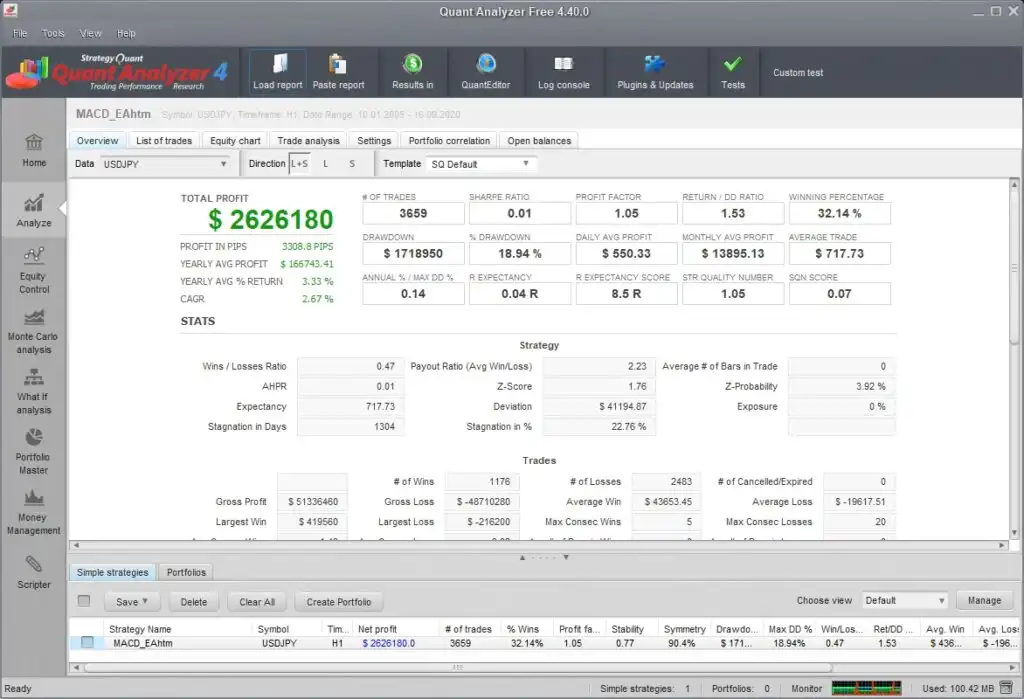
After the report is loaded, the backtest result will be displayed in Quant Analyzer.
How to Analyze MT4 Backtest Results
Once the MT4 report is loaded, you can start reviewing the backtest result from different angles. The goal is not only to confirm whether the EA was profitable, but also to understand where it was weak.
Trade Analysis
The Trade analysis tab allows you to review results by year, day, hour, and other time periods.
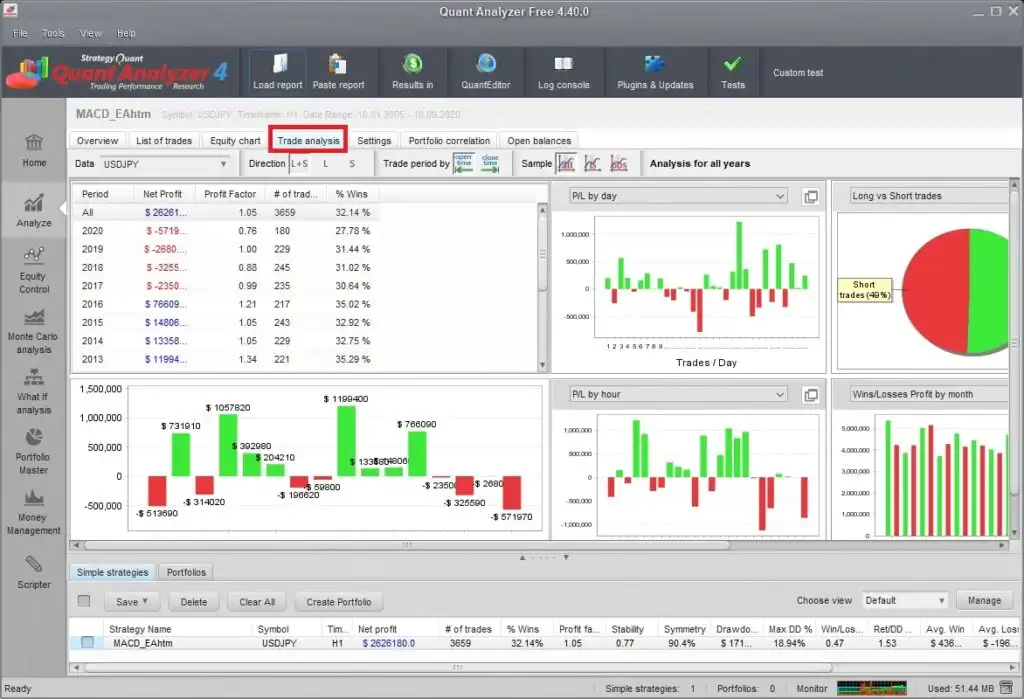
For example, if some years are negative, you can double-click a specific year and review the details for that period.
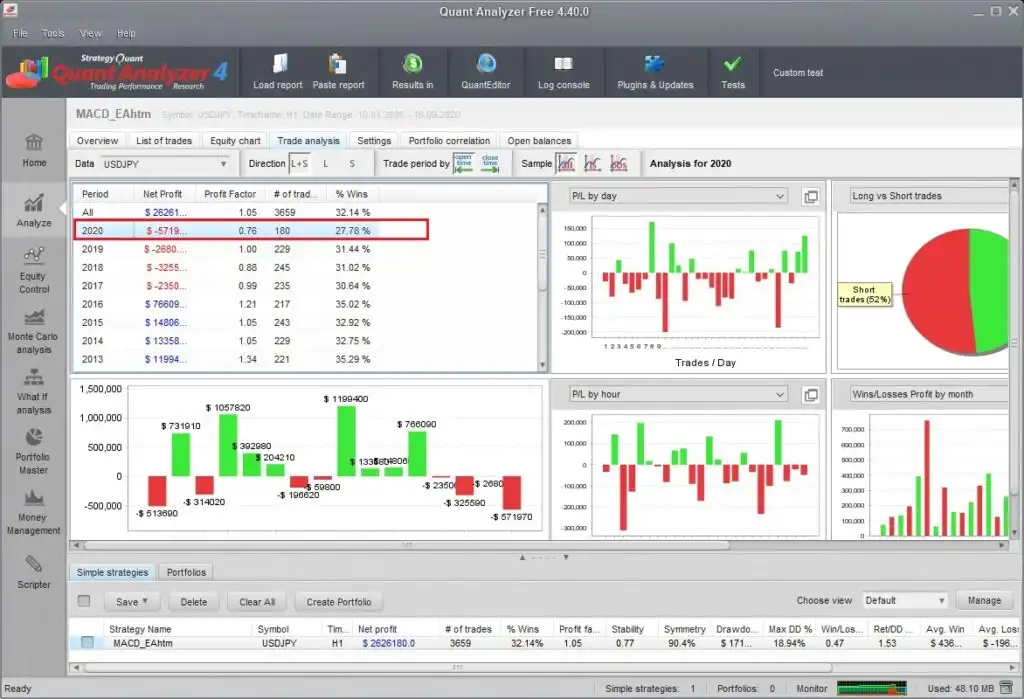
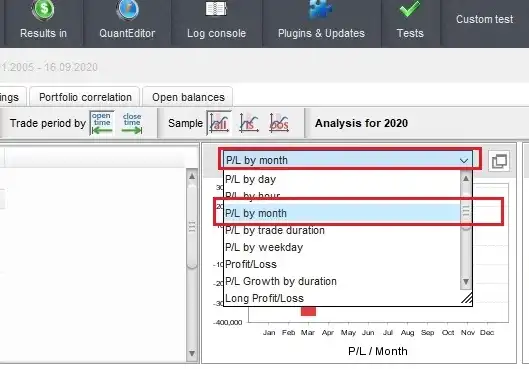
You can also switch the chart type to monthly profit/loss to see which months caused large losses.
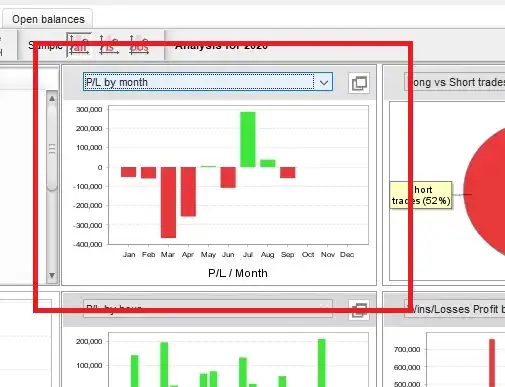
If a specific month has a large loss, you can go back to MT4 and review that period with visual mode. This helps you check whether the loss was caused by abnormal market conditions, weak entry timing, delayed exits, or another issue.
List of Trades
The List of trades tab shows the individual trades from the report. This is useful when you want to inspect the biggest losing trades or review how long trades were held.
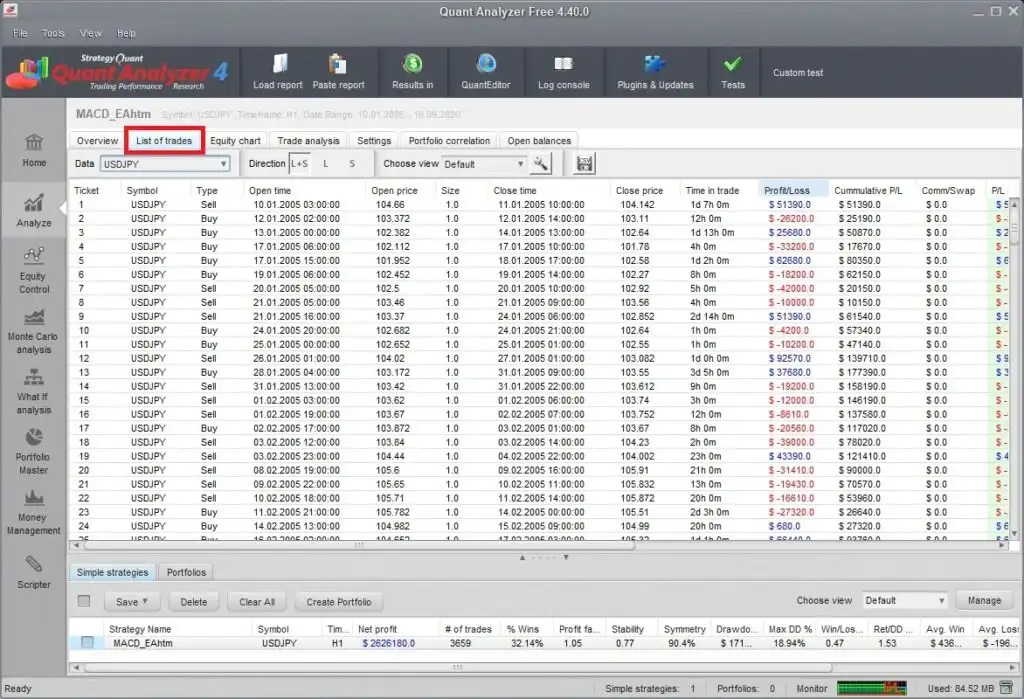
For example, you can sort trades by Profit/Loss and check the largest losing trades first.
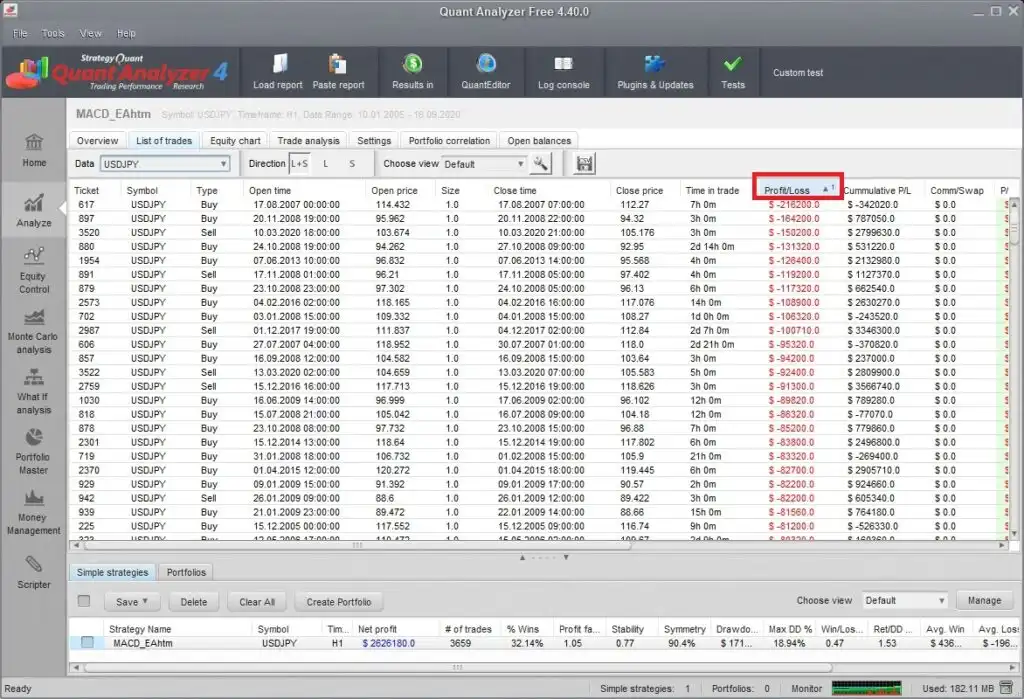
You can also check Open Time, Close Time, and Time in trade. If a losing trade was held for a very long time, it may indicate that the EA could not exit quickly enough during an unfavorable market condition.
Example: Finding Weak Trading Hours
Here is a simple example of how Quant Analyzer can be used to improve an EA. Assume that an EA has a profit factor of around 1.05. It is slightly profitable, but the result is not strong enough.

First, check the performance by hour in the Trade analysis screen.
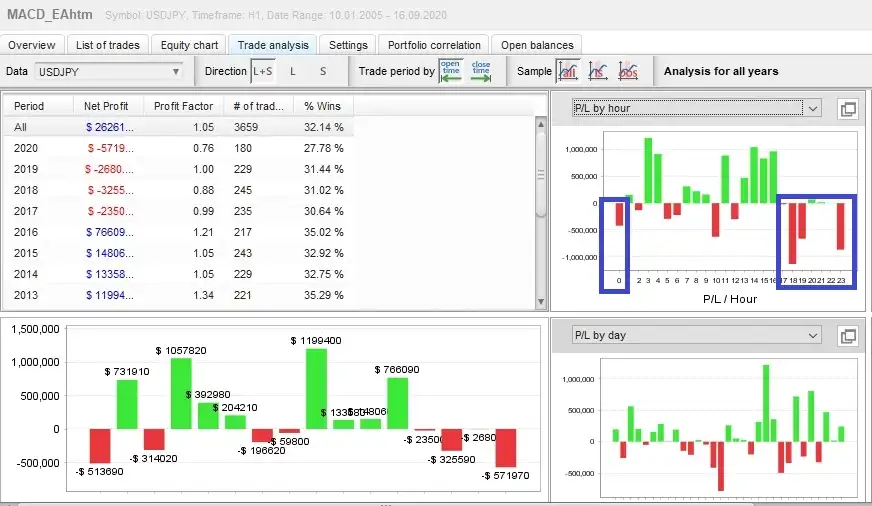
If the EA performs poorly during a specific time range, you can consider adding a time filter. For example, if the result between 18:00 and 00:00 is consistently poor, you may test a version of the EA that avoids trading during that period.
After applying a time filter, run another backtest and compare the result.
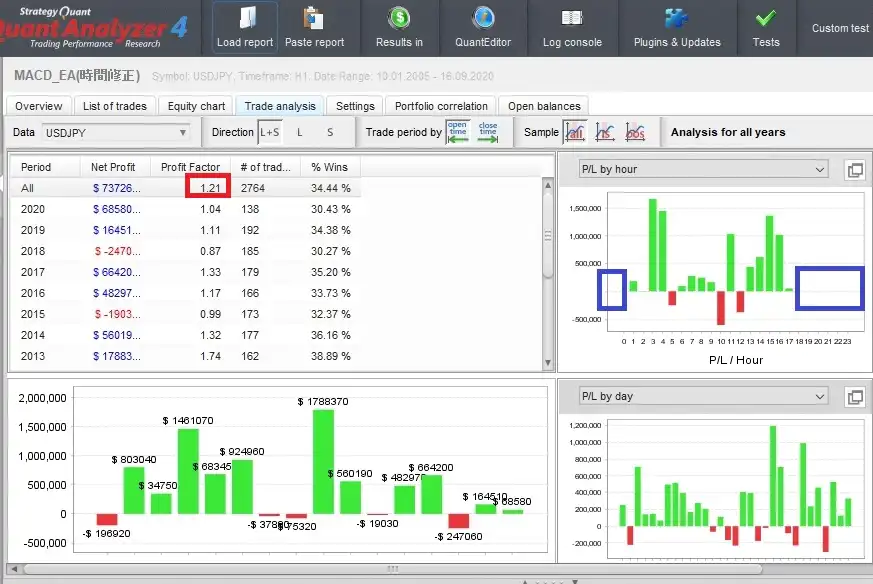
In this example, avoiding a weak trading time improved the overall result. However, you should not add filters only because they improve one backtest. Always check whether the filter has a reasonable trading logic behind it.
Be careful about curve fitting:
If you remove bad periods only to make the backtest look better, the EA may become overfitted. A time filter should have a reasonable market explanation, such as low liquidity, wider spreads, or a specific session behavior.
If you remove bad periods only to make the backtest look better, the EA may become overfitted. A time filter should have a reasonable market explanation, such as low liquidity, wider spreads, or a specific session behavior.
Practical Ways to Use Quant Analyzer for EA Improvement
Quant Analyzer is most useful when you use it as part of a review process. The goal is not to make the backtest look perfect, but to understand the EA’s behavior more clearly.
| What to Check | Why It Matters | Possible Action |
|---|---|---|
| Hourly performance | Find weak trading hours | Test a time filter |
| Monthly performance | Find months with large losses | Review market conditions during those months |
| Yearly profit factor | Check whether performance is stable over time | Review weak years and compare market environments |
| Largest losing trades | Understand what caused major drawdowns | Review the trades in MT4 visual mode |
| Time in trade | Find trades that were held too long | Review exit rules or stop-loss behavior |
Common Mistakes When Using Quant Analyzer
Quant Analyzer can reveal many useful patterns, but the results must be interpreted carefully.
- Do not remove every bad period without a clear reason.
- Do not judge an EA only by profit factor.
- Do not ignore large losing trades just because the final result is profitable.
- Do not assume that one improved backtest means the EA is robust.
- Always compare the analysis with actual chart behavior in MT4.
A good workflow is to use Quant Analyzer to find suspicious periods or trades, then use MT4 visual mode to check what actually happened on the chart.
Related MT4/MQL4 Guides
- MT4 Backtest Not Working: Strategy Tester Causes and Fixes
- How to Import Dukascopy Historical Data into MT4
- OrderSend Error 129 in MT4/MQL4
- OrderSend Error 130 in MT4/MQL4
- OrderSend Error 131 in MT4/MQL4
- OrderSend Error 134 in MT4/MQL4
FAQ About Quant Analyzer and MT4 Backtest Analysis
What is Quant Analyzer used for?
Quant Analyzer is used to analyze trading reports and backtest results. For MT4 users, it helps review hourly, daily, monthly, and yearly performance, sort trades, and find weaknesses in an EA.
Can Quant Analyzer load MT4 backtest reports?
Yes. You can save an MT4 backtest report from the Strategy Tester and load that report into Quant Analyzer for deeper analysis.
Is Quant Analyzer free?
A free version of Quant Analyzer is available, but some advanced features are limited compared with the Pro version. For basic MT4 backtest review, the free version can still be useful.
What should I check first in Quant Analyzer?
A good starting point is to check performance by year, month, day, and hour. Then sort trades by profit or loss to review the largest losing trades.
Can Quant Analyzer help improve an EA?
It can help you find weak periods, large losing trades, or unstable performance patterns. However, any EA modification should be based on a reasonable trading idea, not only on making one backtest look better.
What is the risk of using Quant Analyzer incorrectly?
The main risk is curve fitting. If you remove bad trades or bad time periods only to improve the backtest, the EA may not perform well in future market conditions.
Summary
Quant Analyzer is a practical tool for analyzing MT4 backtest reports in more detail. It helps you find weaknesses that are not easy to see in the standard MT4 report.
- Quant Analyzer can load MT4 backtest reports.
- You can check hourly, daily, monthly, and yearly performance.
- You can sort trades by profit, loss, and trade duration.
- It is useful for finding weak trading hours and large losing trades.
- Analysis results should be confirmed with MT4 visual mode when possible.
- Be careful not to overfit an EA based only on one backtest result.
If you want to understand why an EA wins or loses, Quant Analyzer is a good tool to add after running a normal MT4 backtest. Start with the free version, load one MT4 report, and check where the EA’s weaknesses appear.